Now we have designed the simulator, add a new MAC protocol to NS2, and implement the Random Resend MAC protocol, the final part will be analyze the trace file to measure the performance of our new protocol.
Format of the Trance Entry
One line in the trace file may look like this.
s 0.010830867 _70_ MAC  --- 27 cbr 148 [0 46000000 8 0] ------- [70:0 0:0 32 0] [0] 0 0
|      |        |   |        |  |   |
|      |        |   |        |  |   +----- Packet Size
|      |        |   |        |  +--------- Traffic Type
|      |        |   |        +------------ Packet UID
|      |        |   +--------------------- Layer
|      |        +------------------------- Node ID
|      +---------------------------------- Time
+----------------------------------------- Event Type
You can find more details about the trace format here.
Trace Filtering
In this project, we're only interested the traces that
- From MAC layer, and
- With CBR traffic type
- With Event Type in "Send"(s), "Receive"(r) and "Drop"(D)
So we first filter those not-so-interesting traces out.
def filter(trace_file) :
  with open(trace_file, 'r') as f :
    raw_lines = f.read().split('\n')

  print("%s raw traces found." % (len(raw_lines)))

  traces = []
  for line in raw_lines :
    fields = line.split(' ')
    if fields[0] not in ['s', 'r', 'D'] :
      continue
    if not (fields[3] == 'MAC') :
      continue
    if not (fields[7] == 'cbr') :
      continue

    traces.append({'action': fields[0], 'node': fields[2], 'pid': int(fields[6])})


  print("%s filtered traces found." % (len(traces)))
  return traces
Delivery Probability
To calculate the delivery probability, we need to know
- How many unique packets are sent out by all source nodes?
- How many unique packets received by the sink node?
These two metrics can be easily obtained as following:
nodes = set(t['node'] for t in traces)
print("%s nodes found." % (len(nodes)))

sent = len(set(t['pid'] for t in traces))
recv = len(set(t['pid'] for t in traces if t['node'] == SINK_NODE and t['action'] == 'r'))

print("sent: %d, recv: %d, P: %.2f%%" % (sent, recv, float(recv)/sent*100))
Remember that we use LossMonitor as sink? Now is the time to cross-reference
the results here with the ones from the stats file. The total received packets
number should match.
The final delivery probability w.s.t the repeat count X is somehow like this
in my case (packet size is 16 bytes).
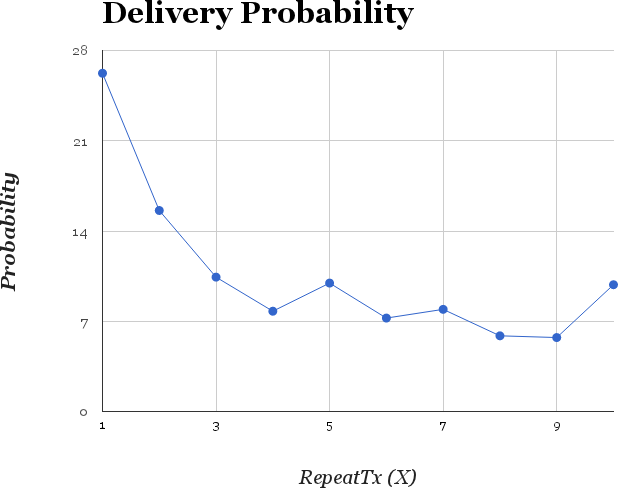
Note that somehow this is not the ideal probability distribution. Please refer to this paper for theoretical analysis and also simulation results.